While we have documented how you might consider Monitoring a Cluster with Galera Manager, we’d also like to take you through a bit more of what is available, before our webinar this week. Please signup for a live demo from install to deployment and management.
You might be used to SHOW GLOBAL STATUS LIKE 'wsrep_%'; from the command line, but why not take a look at all of this on a graph, over time, within the GUI of the Galera Manager? What happens when you feel a node is getting overwhelmed? You tend to check wsrep_flow_control_paused, which returns the percentage of time the node was paused because of Flow Control (normally you do this after a FLUSH STATUS however now you get it graphed over time). Sometimes you want to monitor key metrics like: local state, cluster status & size, flow control being paused, and the local receive/send queue average. Overall, from queue sizes, to flow control, to number of transactions for a node (and in bytes), as well as replication conflicts, Galera Manager can solve for all this with over 600 metrics that you can look out for.

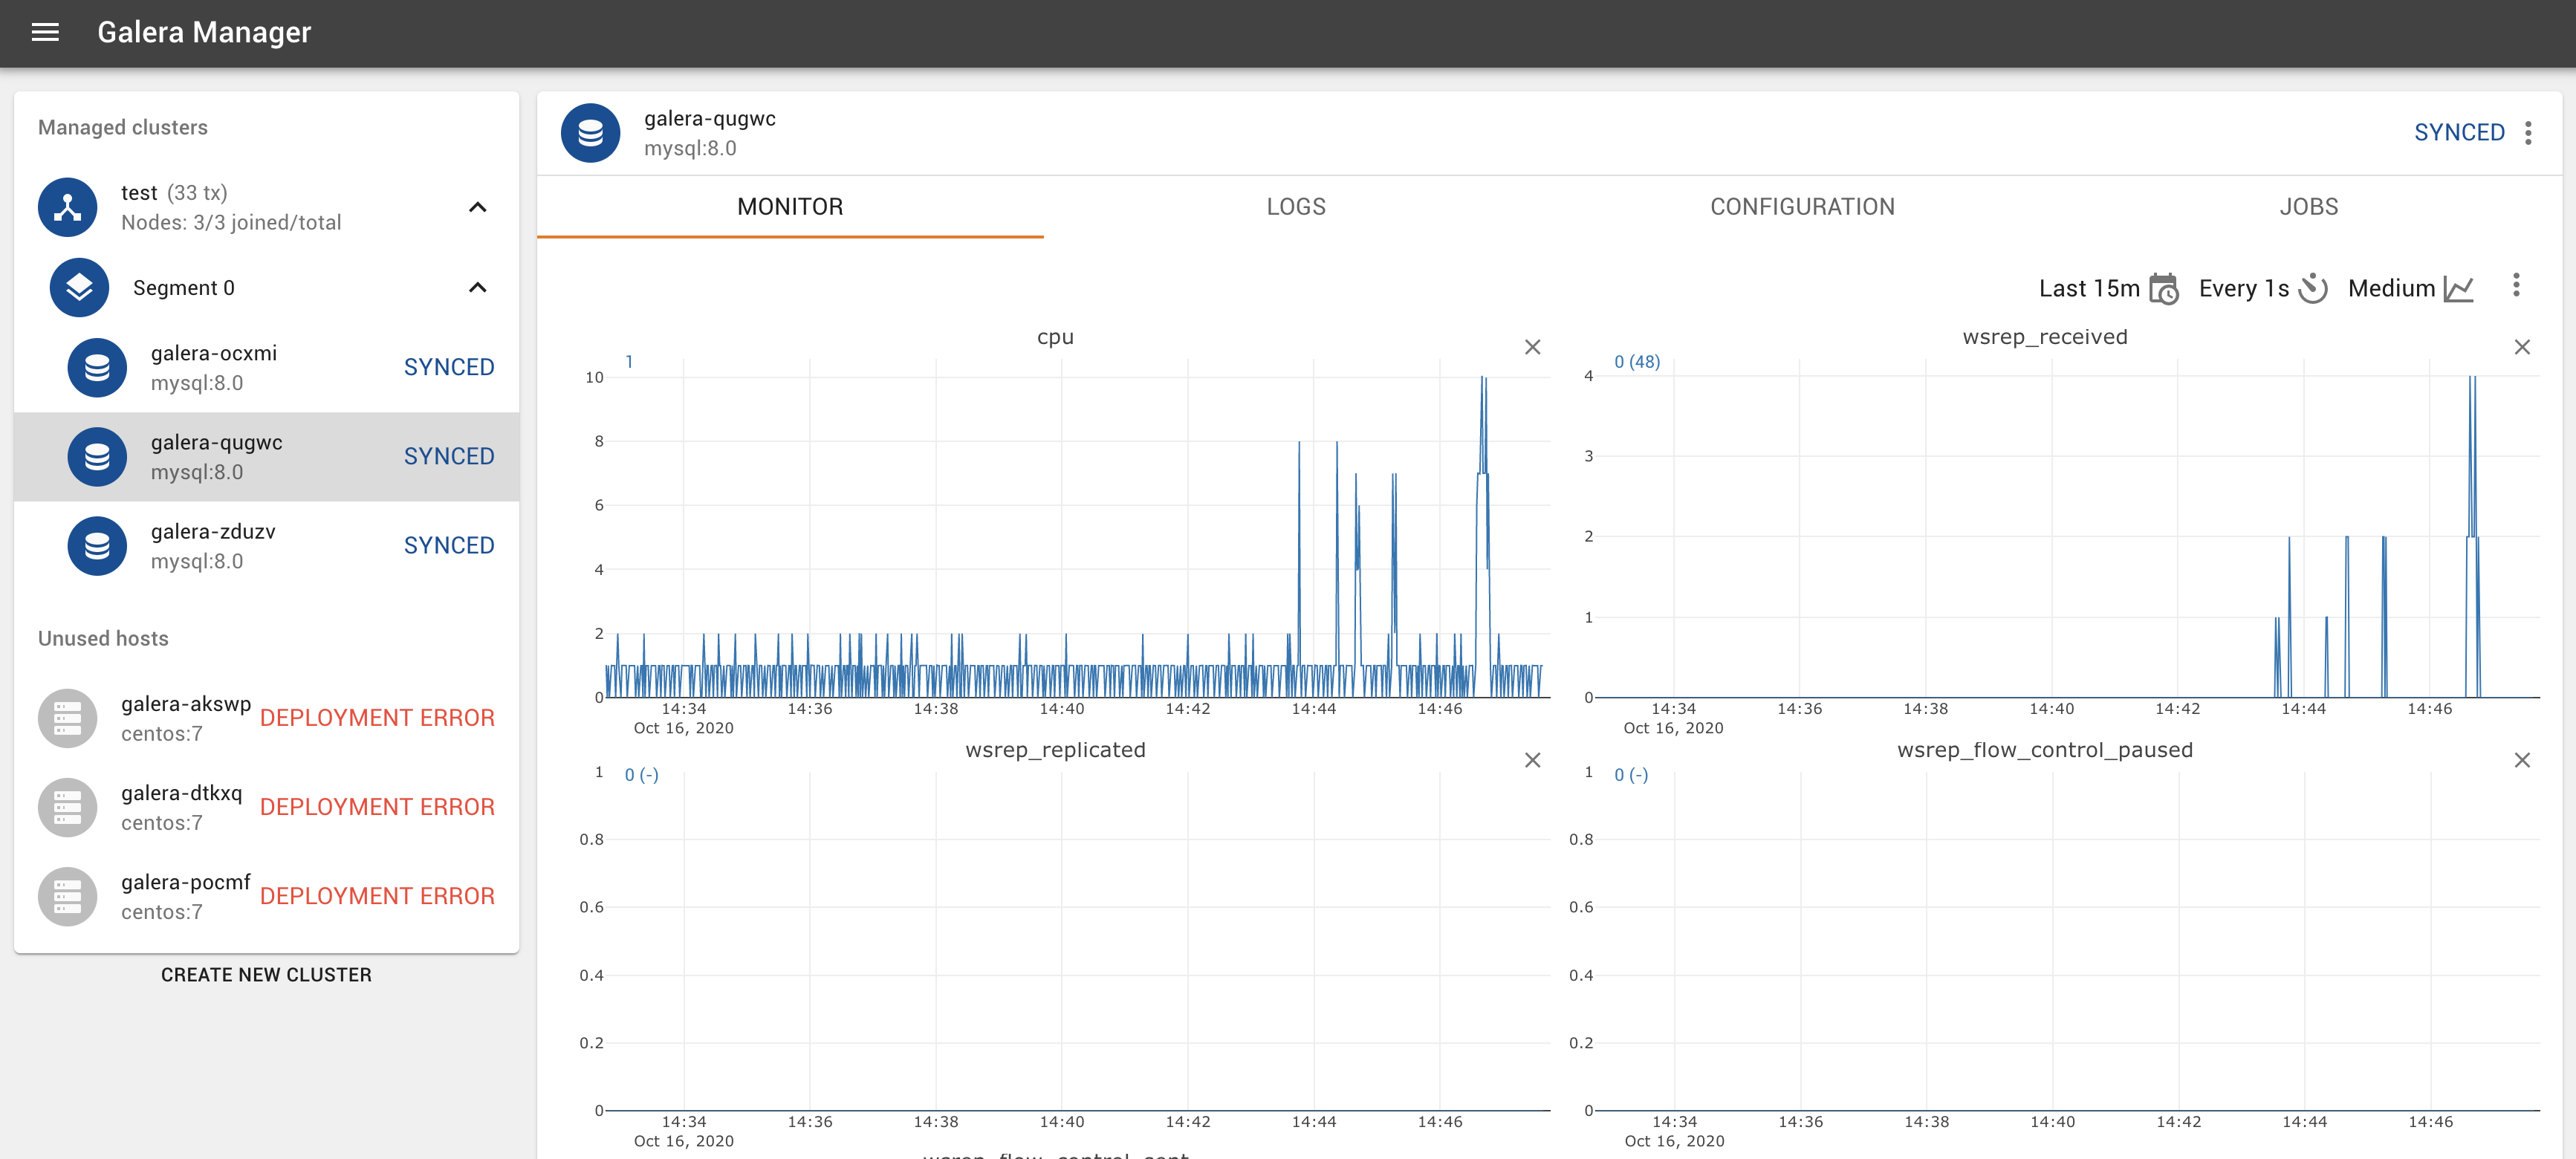
Once you have deployed a cluster in Galera Manager, you will be able to get a general overview from the Monitor. By default, you get to see CPU information, wsrep_received (total number of write-sets received from other nodes), wsrep_replicated(total number of write-sets sent to other nodes, via replication), wsrep_flow_control_paused (time since last FLUSH STATUS that replication was paused due to flow control), and wsrep_flow_control_sent (number of FC_PAUSE events the node has sent).
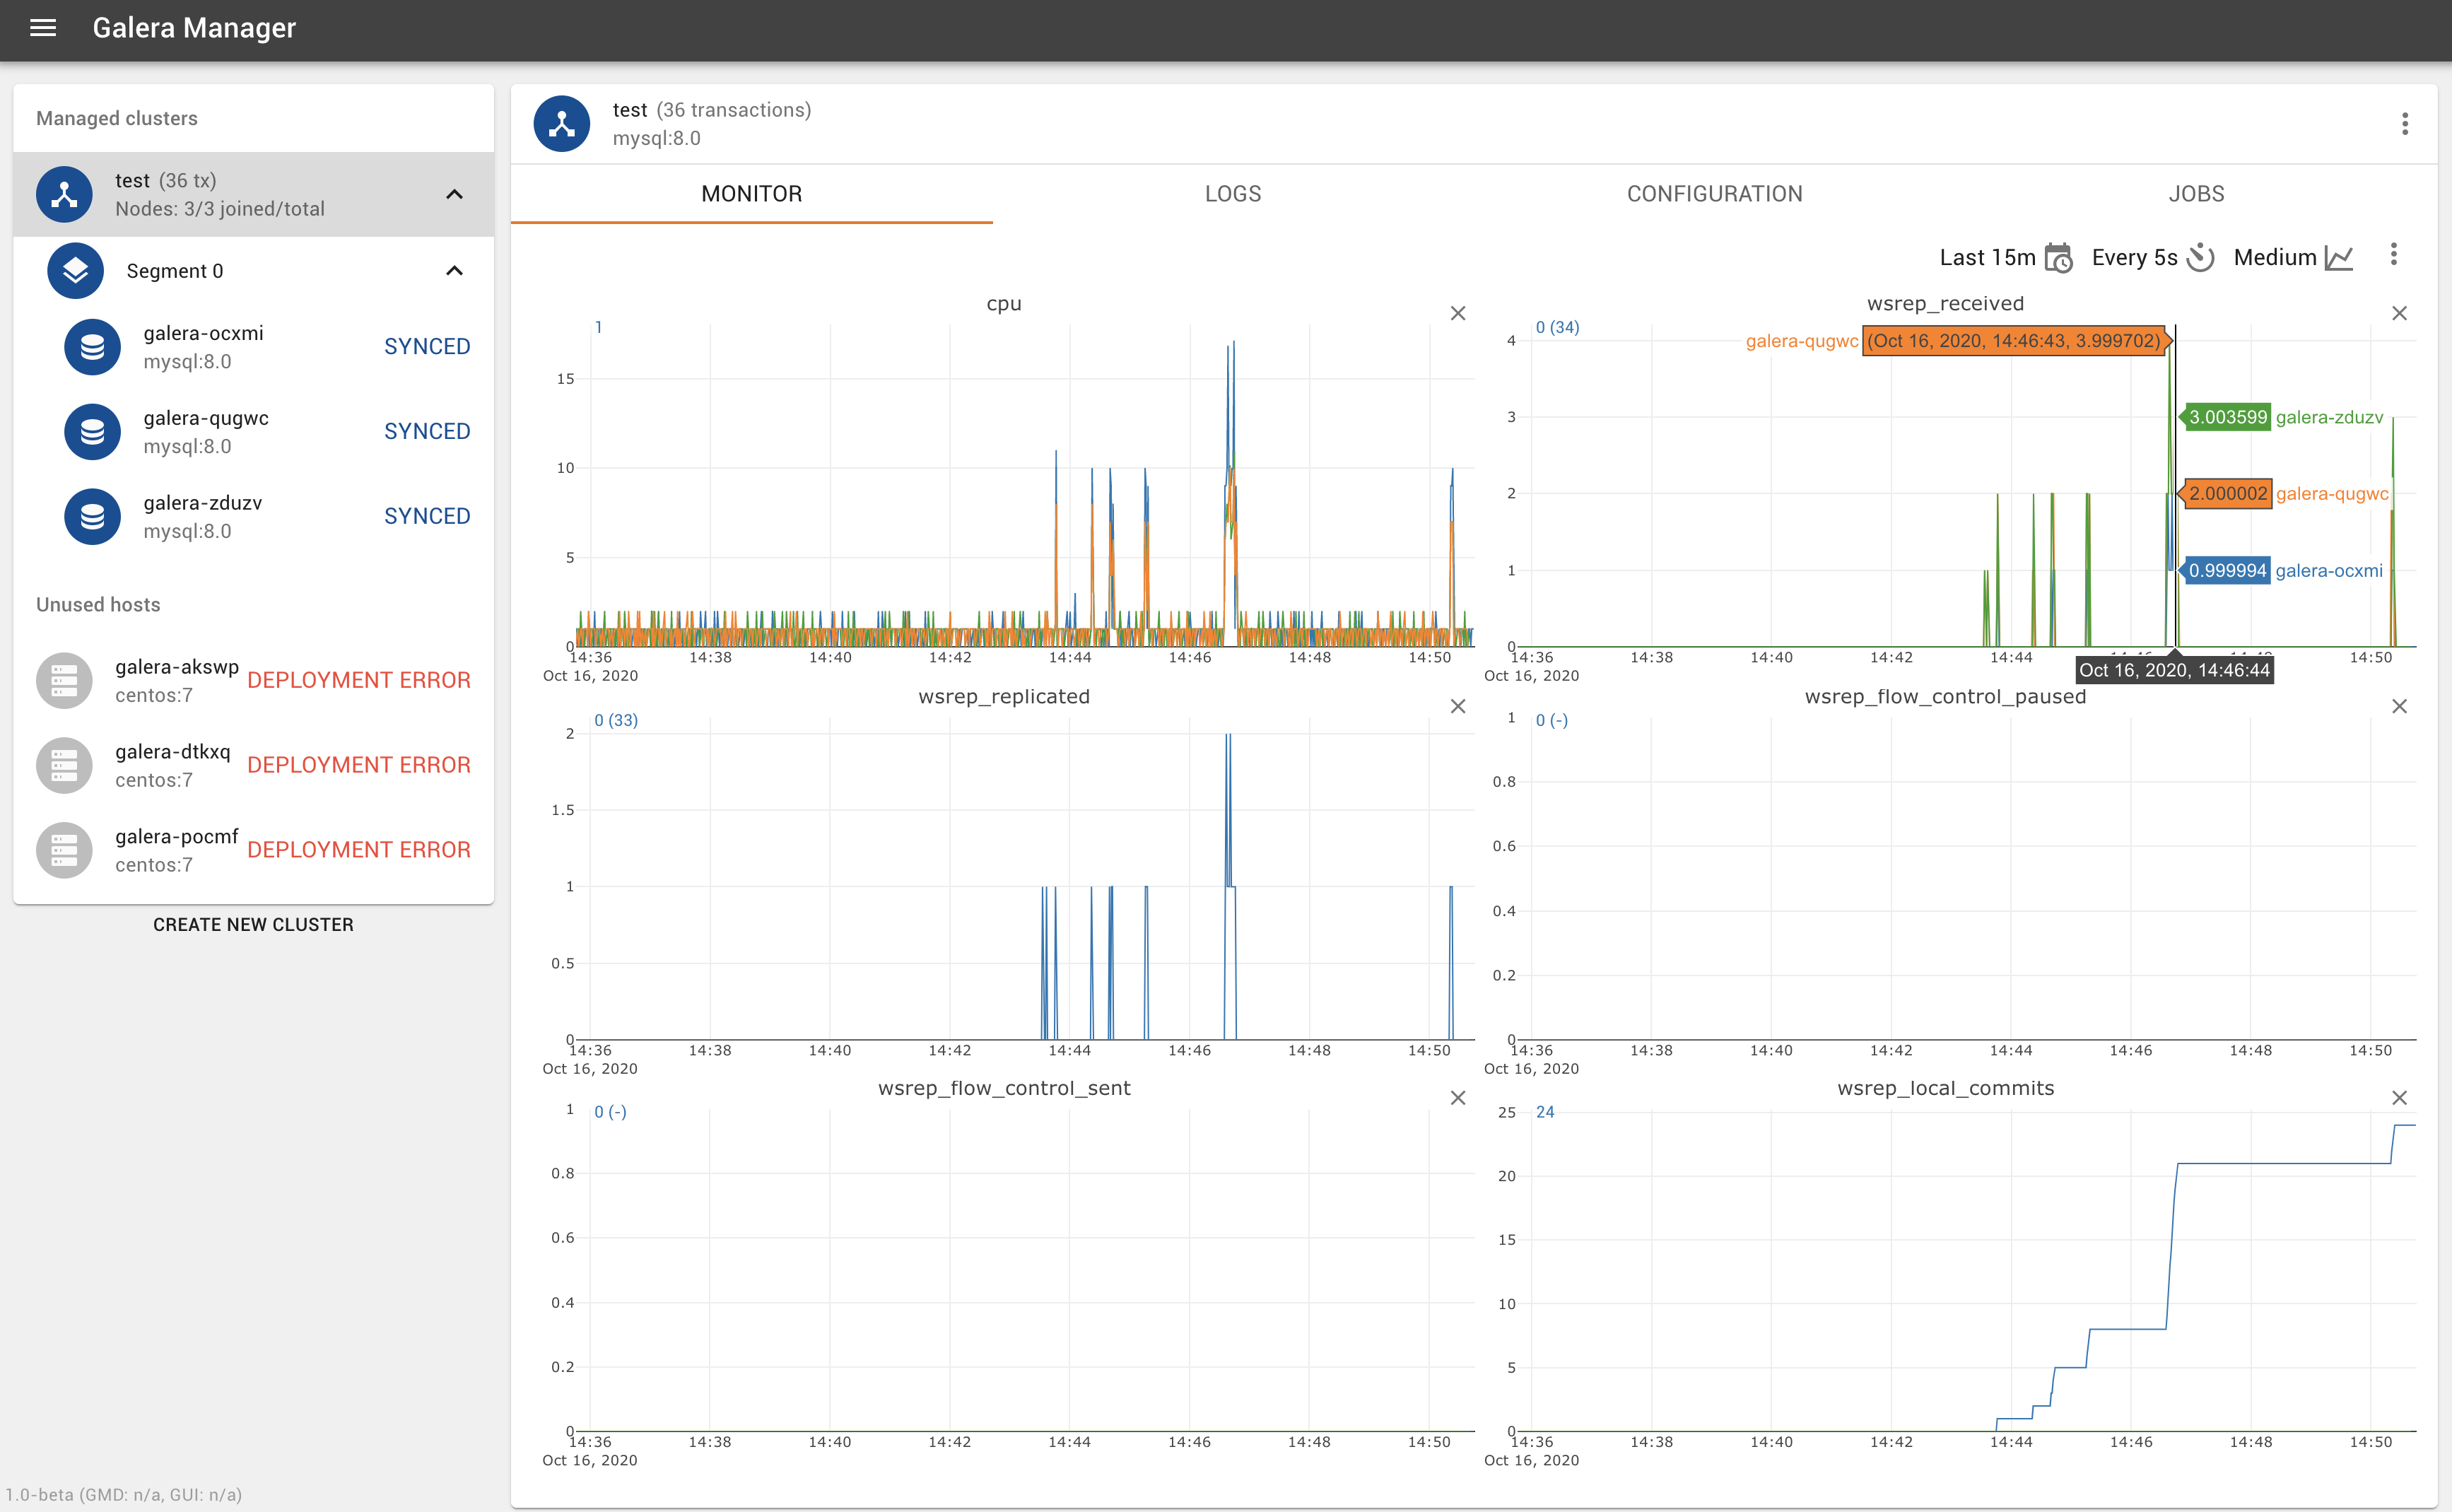
Connect to one of the nodes (the Configuration tab, will provide your database address and the root password that you can use to connect), and start doing some data insertion. You will then notice that the CPU time, wsrep_received, and even wsrep_replicated will change. For completeness, we also added wsrep_local_commits to monitor, which is the total number of transactions committed.
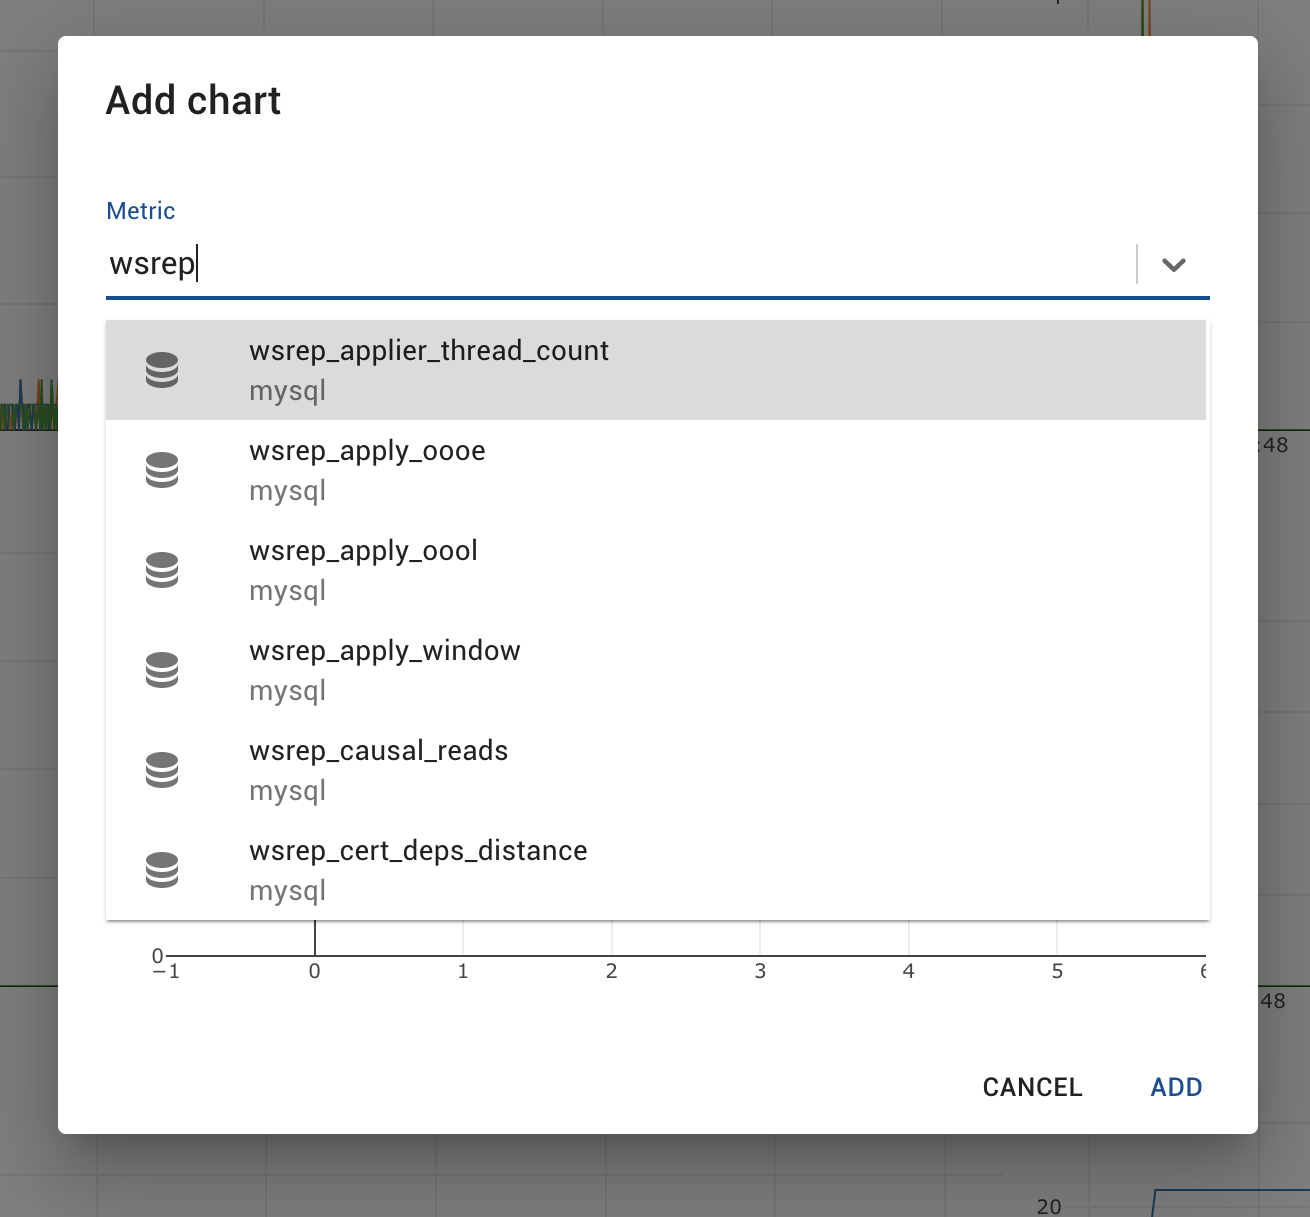
Since there are hundreds of metrics to chose from (currently 620), why not focus on adding some of your own?
The useful thing about the cluster view is that you can also dive deeper into seeing what is happening on a per node basis. To some extent this can also ensure that all your nodes are being utilised in a efficient manner and there aren’t any preferred nodes from the application or the proxy.
In upcoming releases, we will focus on how you can also monitor the effectiveness of streaming replication, so that you can visually see how the long running transactions are performing and if you need to change fragment sizes appropriately. Let us know what else you would like to see from Galera Manager, by sending us feature requests at: info@codership.com.
For further reading, please visit Monitoring a Galera Cluster, Using Status Variables to monitor a Galera Cluster, and Database Server Logs.