Why Did We Start Working on Streaming Replication
I was in a harbor waiting for a ferry, when I suddenly got pulled into a support request to troubleshoot a stalling cluster. Talking with the DBA it soon turned out that his cluster was executing a background batch job for maintenance. This maintenance job executed a big number of data changes at a low pace in a single transaction. The cluster hang started soon after the batch job had committed in the first node. The hang was caused by this one big transaction taking a long time to apply in secondary nodes. The cluster was apparently choking for a too big bite. The DBA was eager to start killing potentially harmful connections, but in a cluster, this is hardly ever a good idea, and especially in this situation would not be even effective. Our options were to shutdown all but the first node, and join nodes back, one by one by State Snapshot Transfer (SST), or alternatively we could just wait. Based on the information of the maintenance transaction, the expected downtime by waiting was possible to tolerate. The customer problem was solved, by waiting, but the total toll was 27 minutes of cluster stalling. When I boarded the ferry, it was obvious that something must be done to prevent large transactions choking clusters.Metrics on the Problem
After the trip, and back to my laboratory, I started simulating the problem seen on the customer site. And I finally came up with a test scenario simulating the turbulence caused by a large transaction in a cluster. In the scenario, the cluster is processing a constant flow of well behaving small transactions, which should saturate the transaction through-put rate at a stable level. And then we enter a large transaction to execute in the first node and monitor how long it takes to operate in the first node and what happens after the replication. But enough talking, see for yourself what happens when a large transaction hits the first node in the cluster. In this exercise a two node cluster is installed on my laptop, which has also background media apps running to keep the field engineer entertained for otherwise monotonic benchmarking work ahead. So this is not a perfect deployment for stability, and metrics show some fluctuation, but overall, the impact of large transaction for transaction throughput is clearly visible from the metrics recorded. The benchmark has a very small database (4 tables, 1K rows), where 8 client connections submit randomly single row autocommit updates into the first cluster node. Despite the small data set, these updates are mostly non-conflicting, and the cluster can execute this transaction load at an average of 2.3K transactions per second. These connections simulate the normal payload transaction load in the cluster. There is also a separate table with 2.5M rows, and to simulate a large transaction, the benchmark launches a single update statement to update all the rows in the big table. Running the large update, alone in an idle cluster takes ~20 secs. Here is a visualization, of what happens when the large update is submitted to the cluster while having to simultaneously process the payload.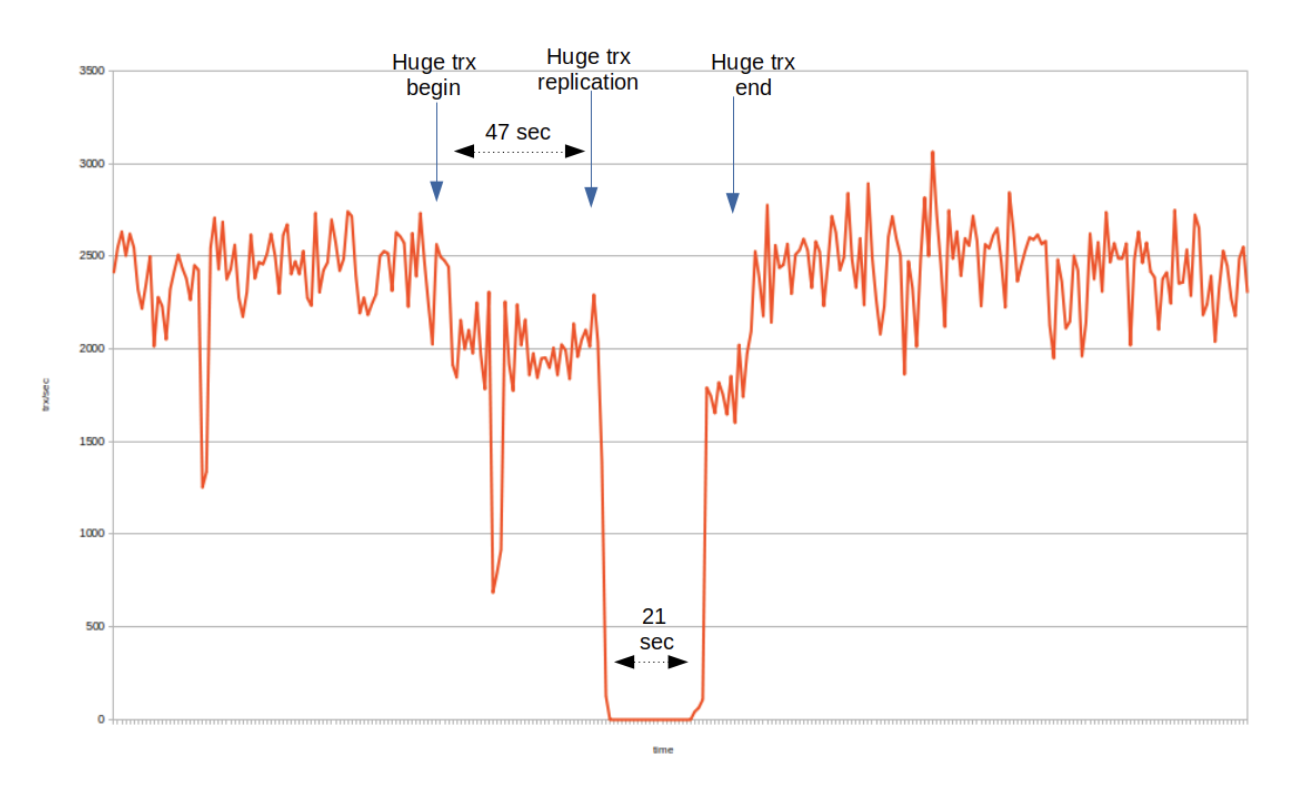 Here you can see that the payload transaction load is initially quite stable in average 2.3K trx/sec level (with one dip down to 1.3 trx/sec level, though). The large transaction is submitted at the “Huge trx Begin” mark, and the execution of the large transaction continues in the first node for 47 secs, until the “Huge Trx Replication” mark in the chart. Due out the large transaction execution phase, cluster transaction throughput goes down to level of ~2K trx/sec. This dip is simply because of the low performance of the cluster HW capacity (both nodes compete for the same CPU cycles, and the large transaction takes its share of first node processing capacity). In a high performance cluster deployment, the large transaction effect during the executing phase in the first node, is generally not seen.
At the “Huge trx replication” mark, the large transaction has completed the executing phase and it replicates one write set containing all the update row events. The large transaction also commits in the first node in this point, and from the perspective of the application who has sent the large transaction, all looks good now. The large transaction was executed in 47 secs, which was more or less the expected execution time and it has successfully committed in the first node.
However, the actual problem only begins now. When the write set of the large transaction arrives into the secondary node, it will be applied among all other payload transactions’ write sets. The secondary node is configured with 8 applier threads, so it has enough resources for applying these non conflicting write sets in parallel. But, as the cluster has strict commit order policy, all write sets must queue for commit ordering after the applying phase. Now that the applying of the large transaction’s write set takes a lot longer than the reasonable size payload transactions, it means that of the secondary node’s replication applier threads, one is applying the large transaction, and 7 appliers have completed applying payload transactions and are waiting for commit order after the large transaction. In the chart, you can see that this applying phase lasts 21 secs. No transaction can commit during this time, in any cluster node, cluster remains in stalling state.
A quick reminder though: the Galera replication library could be configured to allow out of order committing, by variable: repl.commit_order. But for data safety, this should never be done. Data safety is the first and foremost requirement for a database cluster, after all.
In the chart the “Huge trx end” mark shows when the large transaction was finally committed in the secondary node, and the cluster returns to normal payload transaction processing state. Transaction throughput saturates back to 2.3K trx/sec rate.
Here you can see that the payload transaction load is initially quite stable in average 2.3K trx/sec level (with one dip down to 1.3 trx/sec level, though). The large transaction is submitted at the “Huge trx Begin” mark, and the execution of the large transaction continues in the first node for 47 secs, until the “Huge Trx Replication” mark in the chart. Due out the large transaction execution phase, cluster transaction throughput goes down to level of ~2K trx/sec. This dip is simply because of the low performance of the cluster HW capacity (both nodes compete for the same CPU cycles, and the large transaction takes its share of first node processing capacity). In a high performance cluster deployment, the large transaction effect during the executing phase in the first node, is generally not seen.
At the “Huge trx replication” mark, the large transaction has completed the executing phase and it replicates one write set containing all the update row events. The large transaction also commits in the first node in this point, and from the perspective of the application who has sent the large transaction, all looks good now. The large transaction was executed in 47 secs, which was more or less the expected execution time and it has successfully committed in the first node.
However, the actual problem only begins now. When the write set of the large transaction arrives into the secondary node, it will be applied among all other payload transactions’ write sets. The secondary node is configured with 8 applier threads, so it has enough resources for applying these non conflicting write sets in parallel. But, as the cluster has strict commit order policy, all write sets must queue for commit ordering after the applying phase. Now that the applying of the large transaction’s write set takes a lot longer than the reasonable size payload transactions, it means that of the secondary node’s replication applier threads, one is applying the large transaction, and 7 appliers have completed applying payload transactions and are waiting for commit order after the large transaction. In the chart, you can see that this applying phase lasts 21 secs. No transaction can commit during this time, in any cluster node, cluster remains in stalling state.
A quick reminder though: the Galera replication library could be configured to allow out of order committing, by variable: repl.commit_order. But for data safety, this should never be done. Data safety is the first and foremost requirement for a database cluster, after all.
In the chart the “Huge trx end” mark shows when the large transaction was finally committed in the secondary node, and the cluster returns to normal payload transaction processing state. Transaction throughput saturates back to 2.3K trx/sec rate.
Limiting Max Transaction Size
The problem of cluster choking under large transactions was anticipated very early during the development of Galera, many years back. Protecting the cluster from the effect of large transactions was one design goal, and for this two approaches were developed. With wsrep_max_ws_size variable, a cluster can be configured to reject too big transactions. This variable is enforced in MySQL/MariaDB server side, where the size of accumulating replication events (a.k.a binlog events) is monitored and if wsrep_max_ws_size limit is exceeded, the transaction will abort with a warning. This is an effective method for protecting the cluster, but is a rather rude way to do it. The large transaction is allowed to proceed up to the transaction size limit, and is then rolled back This means a lot of wasted resources and nothing got done after all. The default value for wsrep_max_ws_size is 2G, which is too high to protect the cluster from choking. The Galera replication library has a somewhat similar parameter: repl.max_ws_size. This limits the total size of the replication write set, i.e. the combined size of the replication events and all meta data packed for the write set. Default for repl.max_ws_size is also 2G, so a very big tolerance here. LOAD DATA command is one potential source for causing large transactions, and to support e.g. migrations to Galera Cluster use, we have developed a special method to split LOAD DATA transactions into small INSERT blocks. This was another attempt to protect clusters from potentially harmful large transactions. LOAD DATA splitting can be configured with wsrep_load_data_splitting variable.Enter Streaming Replication
Streaming Replication is the technology that finally solves the large transaction problem. In a nutshell, the architecture looks quite simple:- A large transaction is split into small fragments, which are replicated as separate write sets.
- This transaction fragmentation happens during the transaction execution time in the first node.
- Fragment write sets are applied by a streaming replication transaction in secondary nodes, but not committed. The streaming replication transaction remains alive, to wait for more fragments to arrive for applying.
- At commit time, the last fragment write set will be marked by “commit flag”, which triggers the final commit for the secondary nodes.
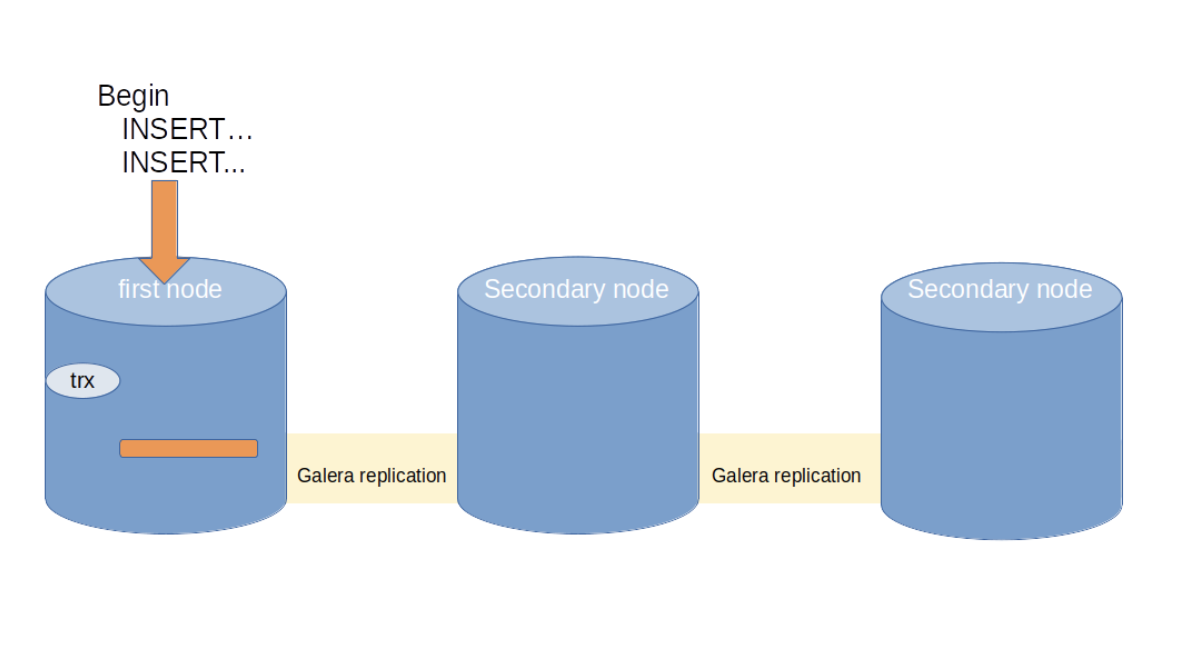 Here a large transaction starts to execute in the first node. As long as wsrep_trx_fragment_size is not exceeded, the transaction remains in the first node only.
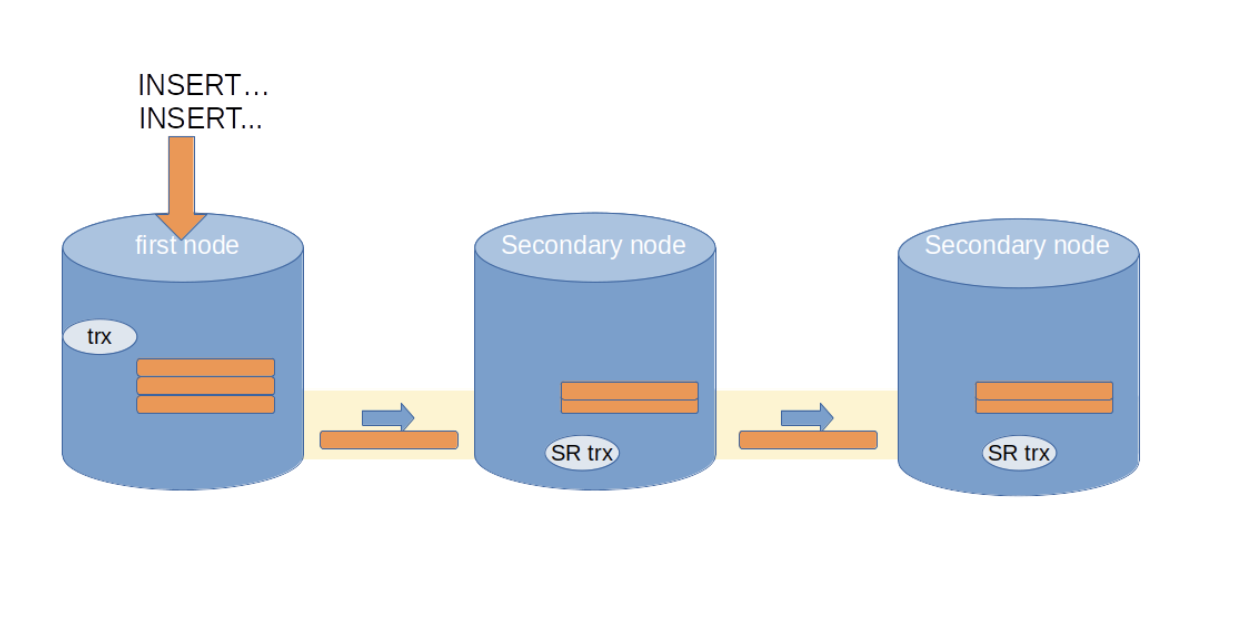 As soon as wsrep_trx_fragment_size is exceeded, a write set is composed of replication events accumulated for the fragment, and replicated to the cluster. The receiving nodes will launch a special streaming transaction transaction (“SR trx” in the image), which applies the events in the fragment transaction and remains alive in the node.
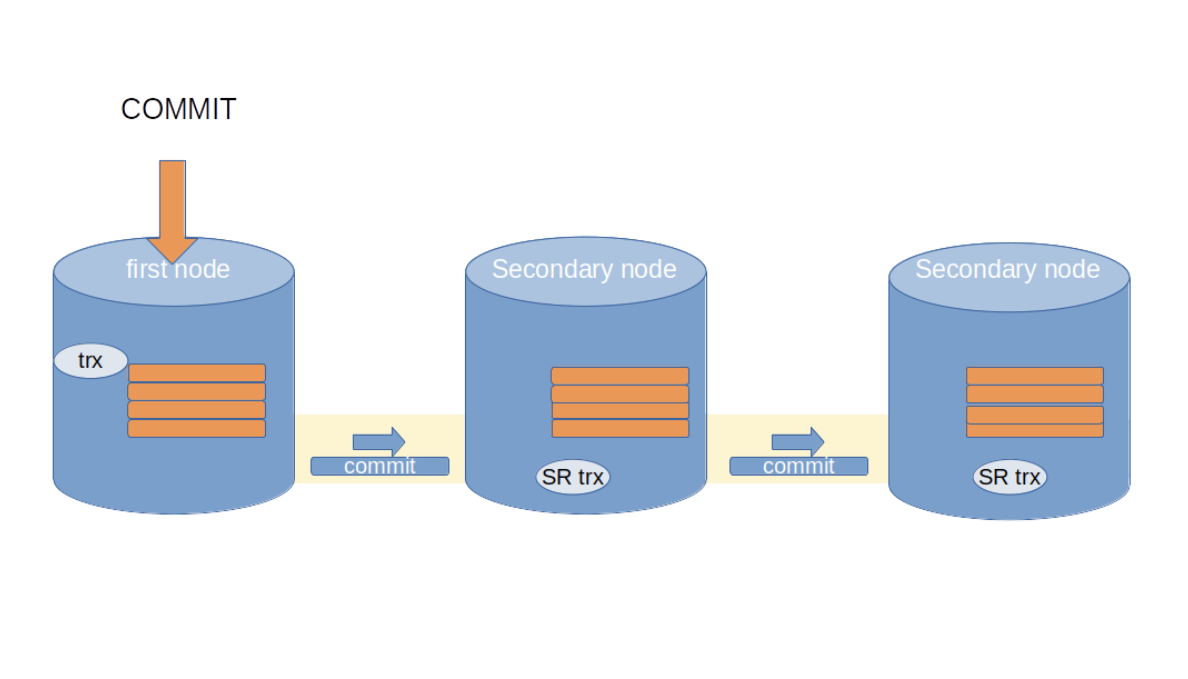 When the client commits the transaction, the last fragment is replicated with a special commit flag. This informs the receiving nodes that the streaming replication transaction must be committed after applying the last fragment.
With this, the cluster has turned into a distributed transaction processing engine. The large translation is being processed in all cluster nodes at the same time. Secondary nodes follow the execution state of the first node practically one fragment size worth of replication events later.
When the client commits the transaction, the last fragment is replicated with a special commit flag. This informs the receiving nodes that the streaming replication transaction must be committed after applying the last fragment.
With this, the cluster has turned into a distributed transaction processing engine. The large translation is being processed in all cluster nodes at the same time. Secondary nodes follow the execution state of the first node practically one fragment size worth of replication events later.
A Brief History of Streaming Replication Development
We started the development of Streaming Replication with MySQL version 5.6 in 2015. The basic functionality for splitting transactions and applying by long term streaming replication handler transactions was rather straightforward to develop, but as usual, the devil lurks in the details. Synchronous database clusters may lose nodes and/or join new nodes at any time, and long term streaming replication transactions must be possible to bring back to life and catch up to the correct state in new joining nodes. This was probably the hardest development challenge to overcome. We developed streaming replication support first for MySQL but for first public releases, we migrated the solution for MariaDB side, with the target to get it in 10.3 version in 2017. We missed the 10.3 train, mostly because our change set was too big for reviews within the 10.3 timeframe. But for 10.4 release, one year later, we were well prepared and streaming replication finally got released. Streaming replication depends on the new replication API (wsrep API version 26), a.k.a Galera 4. MariaDB versions 10.3 and earlier use Galera 3 replication, and versions 10.4 and later use the new Galera 4 replication, this is a rather big leap in terms of replication functionality. In MySQL side, we merged all Galera 4 functionality to the 8.0 release series, which was released in 2020. MySQL 5.7 and earlier use Galera 3 and we have no plans for backporting Galera 4 to 5.7 version.Using Streaming Replication
Configuring streaming replication is rather simple, we have only two configuration variables for tuning:- wsrep_trx_fragment_unit specifies which unit is used for fragment size metrics. Possible values are:
-
-
- Statement – Executed SQL statements in the transaction are counted
- Bytes – The size of accumulated replication events, in bytes, is monitored
-
- wsrep_trx_fragment_size tells the threshold (by the chosen unit) for max fragment size
| column | description |
| node_uuid | Uuid of the SR transaction in source node |
| trx_id | Transaction ID in the source node |
| seqno | Replication sequence number of the replicated fragment |
| flags | Execution mode flags |
| frag | Actual fragment contents |
Large Transaction Simulation with Streaming Replication
Experimenting with a large transaction simulation with streaming replication, shows how a large transaction is processed with different fragment sizes.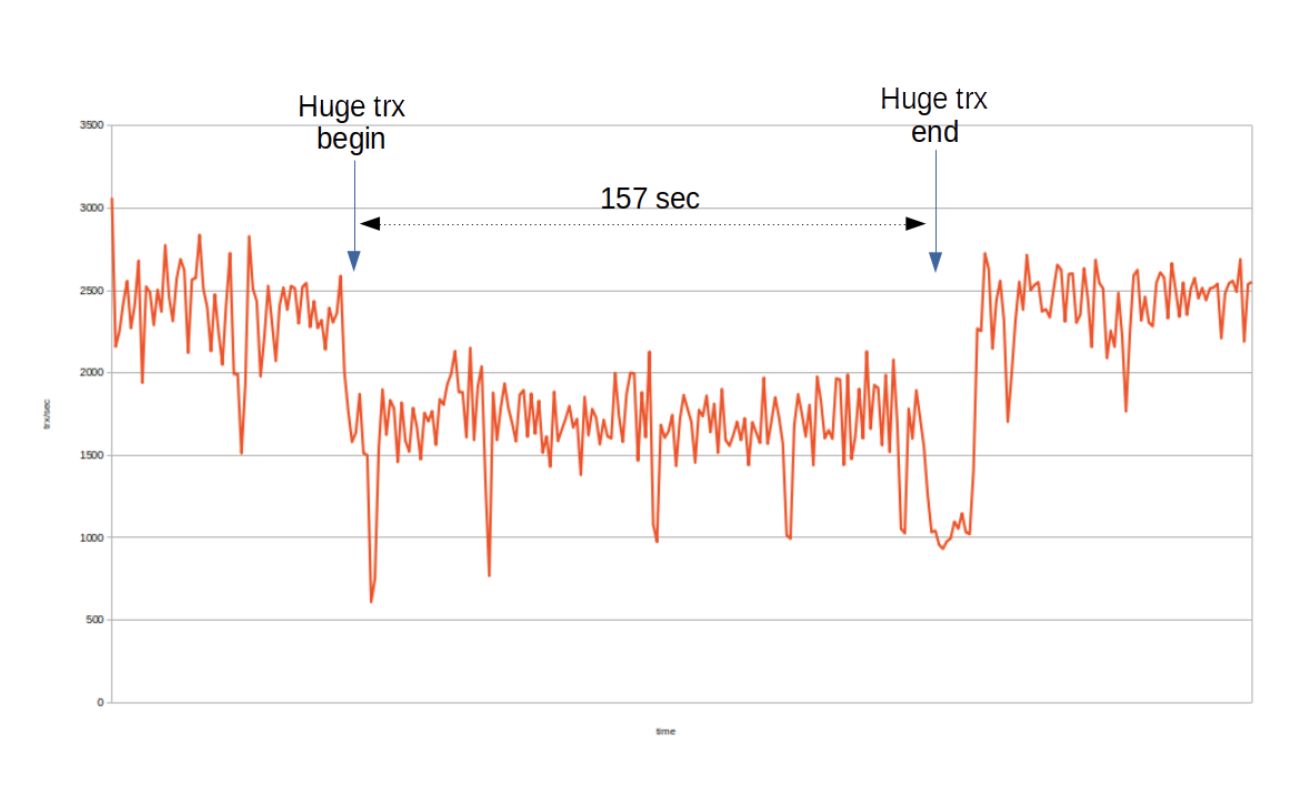 In this experiment, wsrep_trx_fragment_size is set to 10K. i.e. After the replication event set’s accumulated size exceeds 10,000 bytes, a new fragment write set is replicated.The “Huge trx begin” and “Huge trx end” marks show when the large transaction begins processing and commits in the first node. The total execution time is 157 secs, and there is no hanging at all.
Remember that in the non fragmenting experiment, the elapsed time experienced by the application was 47 secs and total time experienced by the cluster was 108 secs.
During the large transaction execution time, the total transaction throughput lowers down to level of 1.7 K trx/sec.
The total number of fragments replicated is 18,875, so instead of one replication round we have now close to 20K replications for this single transaction. These excessive replication rounds extend the transaction execution time considerably. On the other hand, the secondary node is following the state of the transaction quite closely to the first node, and overall transaction throughput level is quite stable and not much lower than the first node’s transaction throughput during the large transaction’s execution time in the non streaming replication experiment.
In this experiment, wsrep_trx_fragment_size is set to 10K. i.e. After the replication event set’s accumulated size exceeds 10,000 bytes, a new fragment write set is replicated.The “Huge trx begin” and “Huge trx end” marks show when the large transaction begins processing and commits in the first node. The total execution time is 157 secs, and there is no hanging at all.
Remember that in the non fragmenting experiment, the elapsed time experienced by the application was 47 secs and total time experienced by the cluster was 108 secs.
During the large transaction execution time, the total transaction throughput lowers down to level of 1.7 K trx/sec.
The total number of fragments replicated is 18,875, so instead of one replication round we have now close to 20K replications for this single transaction. These excessive replication rounds extend the transaction execution time considerably. On the other hand, the secondary node is following the state of the transaction quite closely to the first node, and overall transaction throughput level is quite stable and not much lower than the first node’s transaction throughput during the large transaction’s execution time in the non streaming replication experiment.
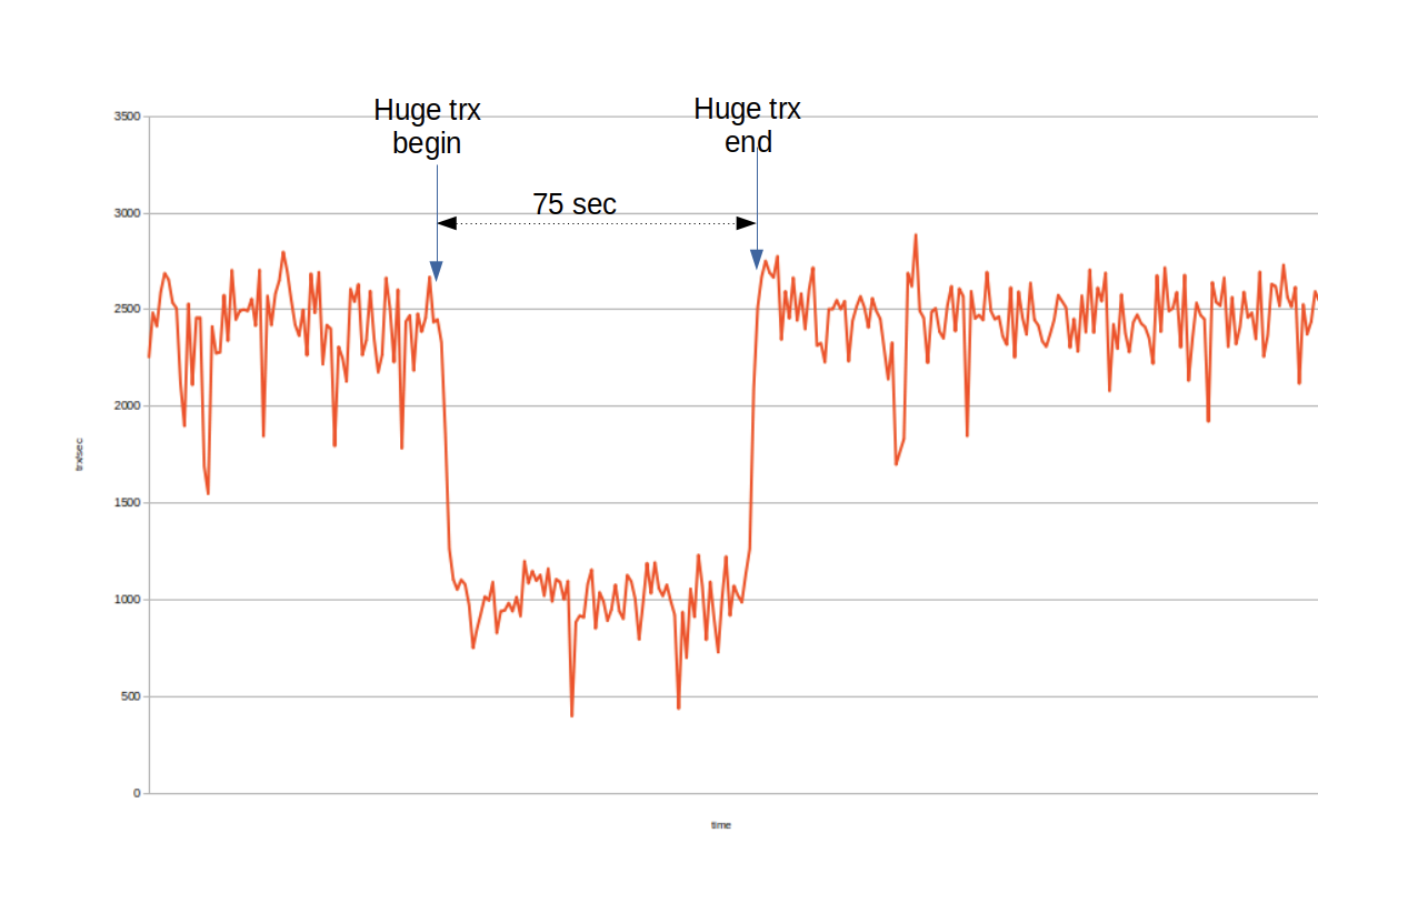 In this experiment, wsrep_trx_fragment_size is set to 100K. i.e. after the replication event set’s accumulated size exceeds 100,000 bytes, a new fragment write set is replicated.The “Huge trx begin” and “Huge trx end” marks show when the large transaction begins processing and commits in the first node. The total execution time is 75 seconds, and there is no hanging at all.
During the large transaction execution time, the total transaction throughput lowers down to level of 1K trx/sec. Total number of fragments replicated is 1,883. This is a lot less than with 10K fragment size, but total transaction throughput has also dropped somewhat, to level of 1K trx/sec.
In this experiment, wsrep_trx_fragment_size is set to 100K. i.e. after the replication event set’s accumulated size exceeds 100,000 bytes, a new fragment write set is replicated.The “Huge trx begin” and “Huge trx end” marks show when the large transaction begins processing and commits in the first node. The total execution time is 75 seconds, and there is no hanging at all.
During the large transaction execution time, the total transaction throughput lowers down to level of 1K trx/sec. Total number of fragments replicated is 1,883. This is a lot less than with 10K fragment size, but total transaction throughput has also dropped somewhat, to level of 1K trx/sec.
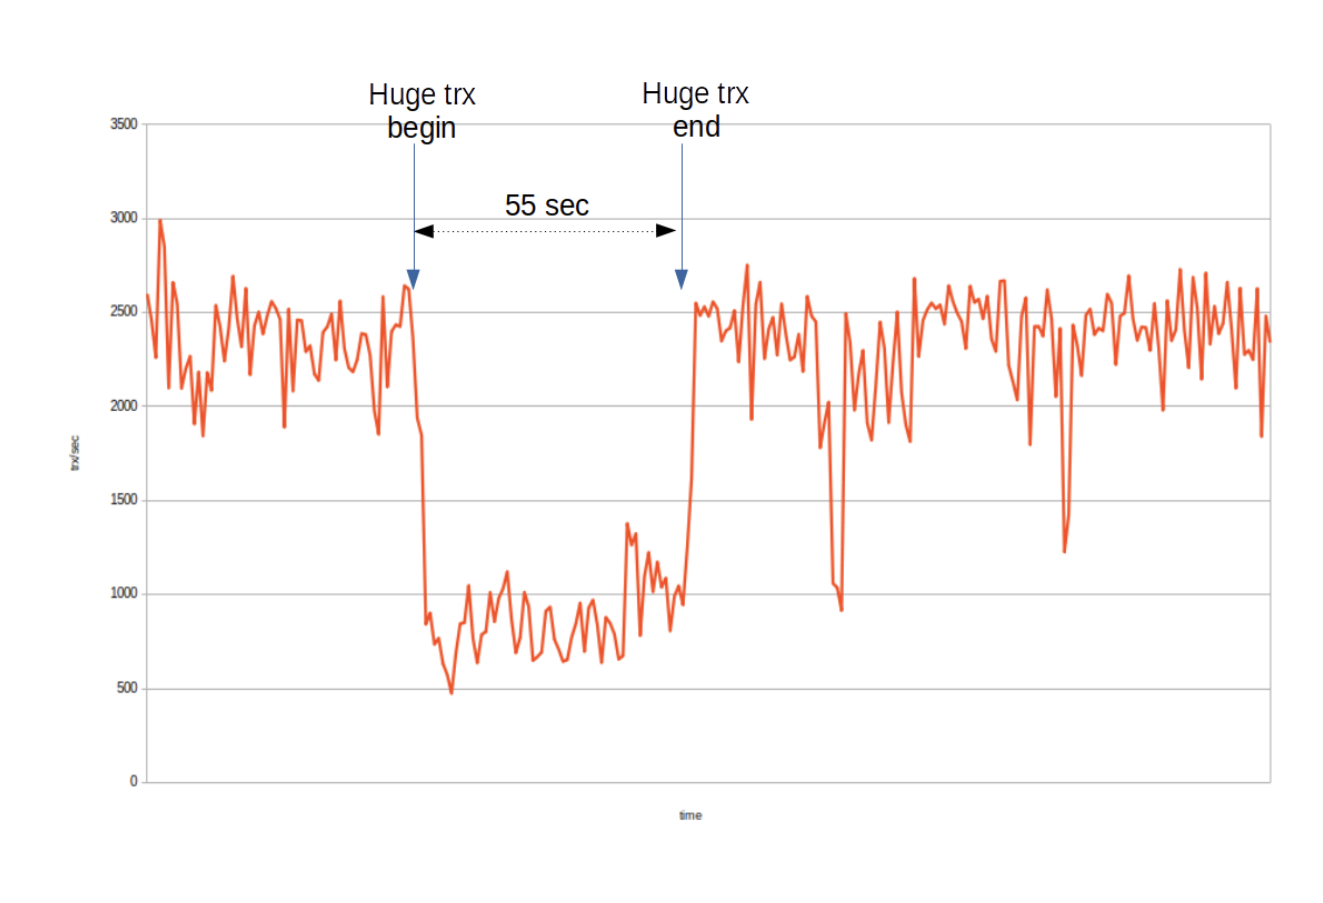 In this experiment, wsrep_trx_fragment_size is set to 1M. i.e. After the replication event set’s accumulated size exceeds 1,000,000 bytes, a new fragment write set is replicated.The “Huge trx begin” and “Huge trx end” marks show when the large transaction begins processing and commits in the first node. The total execution time is 55 seconds, and there is no hanging at all.
During the large transaction execution time, the total transaction throughput lowers down to level of 0.7K trx/sec. Total number of fragments replicated is now 188.
In this experiment, wsrep_trx_fragment_size is set to 1M. i.e. After the replication event set’s accumulated size exceeds 1,000,000 bytes, a new fragment write set is replicated.The “Huge trx begin” and “Huge trx end” marks show when the large transaction begins processing and commits in the first node. The total execution time is 55 seconds, and there is no hanging at all.
During the large transaction execution time, the total transaction throughput lowers down to level of 0.7K trx/sec. Total number of fragments replicated is now 188.